
Higher interest rates reduce the amount you can borrow and push your monthly mortgage payment up. Lower rates do the opposite, expanding your purchasing power and shrinking what you owe each month. The rule of thumb: each 0.25% (25 basis-point) rate move can shift affordability for roughly 1.42 million U.S. households, according to NAHB’s 2026 Priced Out study. That figure is not a rounding error, it reflects how many American household incomes sit right at the edge of qualifying, where a fraction of a percent tips the outcome. Your immediate next step: plug your income, down payment, and a target rate into a mortgage payment calculator and run three scenarios, the current rate, 0.25% higher, and 0.25% lower. The spread between those three numbers tells you exactly how exposed your budget is.
Pro Tip: Don’t run just one scenario. The gap between a 6.5% and a 7.0% rate on a $400,000 loan is over $130 per month, enough to push you above or below a lender’s qualifying threshold.
Table of Contents
- How do monthly mortgage payments change when rates move?
- How do rates affect who qualifies, income, DTI, and priced-out buyers?
- How do rates shape home prices and market demand over time?
- Refinancing and the lock-in effect: who benefits and who stays put?
- How to estimate your personal affordability step-by-step
- Practical ways to protect your affordability when rates rise
- Why small rate moves have surprisingly large distributional effects
- Key Takeaways
- The part most buyers underestimate about rate timing
- Self-employed in Texas? Bank statement loans change the affordability math
- Useful sources and further reading
How do monthly mortgage payments change when rates move?
The formula behind every mortgage payment is straightforward: Monthly Payment = P × r / (1 − (1 + r)^−n), where P is the loan principal, r is the monthly interest rate (annual rate ÷ 12), and n is the total number of payments (loan term in years × 12). On a 30-year fixed loan, n equals 360.

What the formula makes clear is that the interest rate feeds directly into the payment, not as a small adjustment, but as a multiplier that compounds over 360 months. A rate that looks modest on paper produces a materially different payment than one just half a point lower.
The table below shows principal and interest only on three loan sizes across five rate scenarios. Taxes, insurance, and HOA fees are excluded.
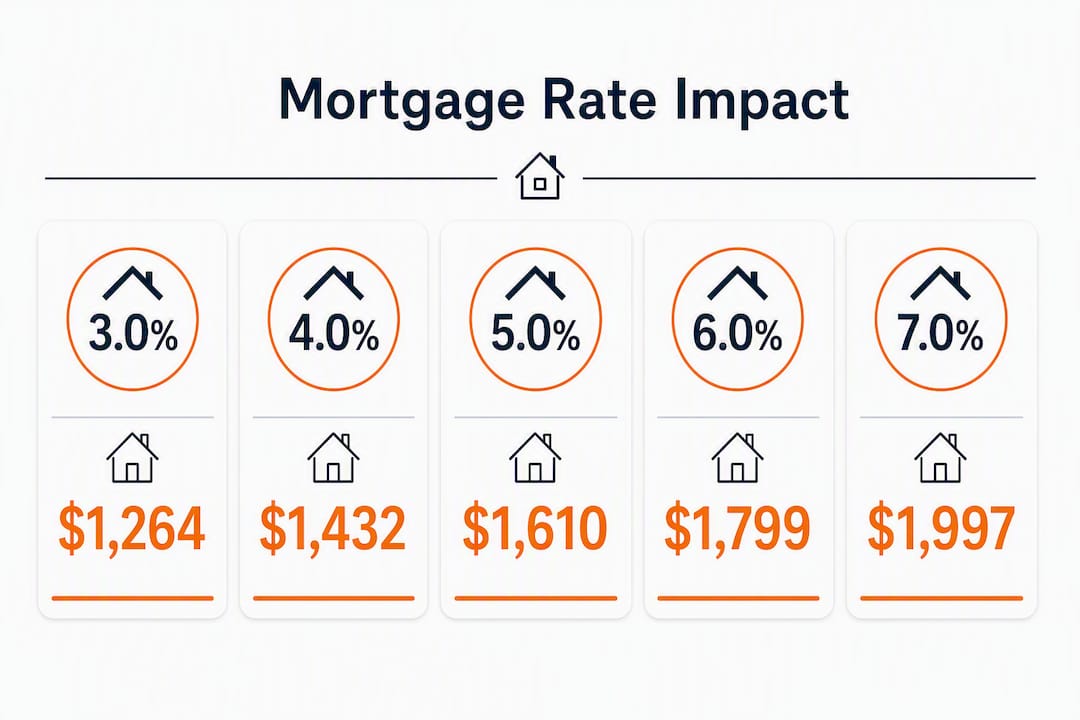
| Rate | $300,000 loan | $400,000 loan | $500,000 loan |
|---|---|---|---|
| 3.0% | $1,265/mo | $1,686/mo | $2,108/mo |
| 4.0% | $1,432/mo | $1,910/mo | $2,387/mo |
| 5.5% | $1,703/mo | $2,271/mo | $2,839/mo |
| 6.5% | $1,896/mo | $2,528/mo | $3,160/mo |
| 7.0% | $1,996/mo | $2,661/mo | $3,327/mo |
Assumptions: 30-year fixed term, principal and interest only, no PMI, taxes, or insurance.
The CFPB’s data spotlight on changing mortgage rates found that the principal and interest on a $400,000 loan rose by $1,265 from trough to peak during a recent rate cycle, a 78% increase in the monthly payment. That is not a marginal shift; it is the difference between a payment that fits a budget and one that breaks it.
To convert a payment into a budget share, divide your monthly P&I by your gross monthly income. A payment of $2,528 on a $400,000 loan at 6.5% represents about 29% of a $105,000 annual income ($8,750/month). Most lenders want that housing ratio at or below 28%, so this borrower is already at the edge before adding taxes and insurance.
Pro Tip: Test 25-basis-point moves in any calculator. On a $400,000 loan, the difference between 6.5% and 6.75% is roughly $66 per month, small in isolation, but it can shift your DTI by a full percentage point.
How do rates affect who qualifies, income, DTI, and priced-out buyers?
Qualifying for a mortgage is not just about whether you can afford the payment. Lenders use your debt-to-income ratio (DTI) to decide whether to approve the loan at all. DTI is your total monthly debt obligations divided by your gross monthly income. Most conventional lenders cap total DTI at 43%, and many prefer to see the housing payment alone stay below 28% of gross income.
Here is where the interest rate becomes a qualification variable, not just a cost variable. When rates rise, your projected monthly payment rises with them, and that higher payment feeds directly into your DTI calculation. Your income has not changed. Your other debts have not changed. But a higher rate can push your DTI above the lender’s cutoff, and the application gets denied.
The St. Louis Fed’s analysis describes this as a supply-of-credit mechanism: rising rates shift the distribution of applicants’ DTI ratios upward, causing formally stable borrowers to cross underwriting thresholds and be rejected. The denial is not a reflection of the borrower’s financial health, it is arithmetic.
Worked example, $400,000 purchase, 20% down, 30-year fixed:
| Rate | Monthly P&I | Annual income needed (28% housing ratio) | Annual income needed (43% total DTI, $500/mo other debts) |
|---|---|---|---|
| 4.0% | $1,528 | $65,486 | $52,093 |
| 5.5% | $1,817 | $77,871 | $61,907 |
| 6.5% | $2,023 | $86,700 | $68,884 |
| 7.0% | $2,129 | $91,243 | $72,512 |
Loan amount: $320,000 (80% of $400,000). Income figures are approximate and exclude taxes, insurance, and PMI.
At a 4.0% rate, a buyer needs roughly $65,000 in annual income to keep the housing ratio at 28%. At 7.0%, that same home requires over $91,000. The AInvest analysis puts the required annual income for a $400,000 home at approximately $105,864 under high-rate conditions when taxes and insurance are included, a figure that excludes millions of households from the market entirely.
NAHB’s Priced Out research reinforces why this matters at scale: household incomes in the U.S. are heavily concentrated near affordability thresholds. A 25-basis-point rate move does not just affect buyers on the margin, it affects the entire cluster of households whose incomes sit near the qualifying cutoff. In high-cost metros, the St. Louis Fed notes, these distributional effects are even sharper because local incomes and DTI ratios are already compressed near lender limits.
How do rates shape home prices and market demand over time?
Rate moves hit demand almost immediately, but home prices respond more slowly. That lag matters for buyers trying to time a purchase.
The main channels work like this:
- Demand suppression: Higher rates price out buyers quickly, reducing the pool of qualified purchasers and slowing sales volume.
- Lock-in effect: Homeowners who locked in rates at 3% or 4% are reluctant to sell into a 7% market. Selling means giving up a low rate and taking on a much higher one for their next home. This reduces available inventory even as buyer demand falls.
- Inventory squeeze: Fewer listings combined with fewer buyers creates a standoff. Prices may not fall as fast as buyers expect because supply is also constrained.
- Delayed price adjustment: Sellers typically hold asking prices firm for months before conceding. Chase’s housing market analysis notes that rates influence demand quickly, but price adjustments often follow only after inventory and seller behavior shift, sometimes six to twelve months later.
Two scenarios illustrate the contrast. When rates fall, qualified buyers re-enter the market quickly, competition for available homes intensifies, and prices often rise faster than the rate savings would suggest. When rates rise sharply, the opposite dynamic plays out: buyer demand drops, but sellers hold prices, inventory stays thin, and the market stalls rather than corrects cleanly.
Local conditions complicate this further. A market with strong job growth and limited new construction can sustain high prices even when rates rise, because demand from employed buyers remains. Conversely, a market with weak job growth and abundant inventory can see prices fall faster. National rate data is a starting point, not a local forecast.
Refinancing and the lock-in effect: who benefits and who stays put?
When rates fall, refinancing becomes the most direct way for existing homeowners to capture lower payments without moving. The mechanics are simple: you replace your current mortgage with a new one at a lower rate, reducing your monthly payment and total interest paid over the life of the loan.
The catch is that not everyone gets served equally. The CFPB’s research found that when refinancing demand spikes, lenders historically prioritize borrowers with higher balances, higher incomes, and stronger credit scores. Borrowers with smaller loans or thinner credit files often wait longer or receive less competitive offers, even when they technically qualify.
The lock-in effect runs in the opposite direction. Homeowners who secured rates at 3% or 4% during the low-rate period face a painful trade-off if they sell: they give up a rate they can never recapture on their next purchase. Many choose to stay put, which pulls listings off the market and tightens supply for buyers, a dynamic the CFPB identifies as a meaningful constraint on housing turnover.
Pro Tip: Before pursuing a refinance, check three signals: your current loan-to-value ratio (LTV should generally be below 80% for the best rates), your credit score (aim for 740+), and how long you plan to stay in the home. If you will move within three years, the closing costs may exceed the monthly savings.
How to estimate your personal affordability step-by-step
Running your own numbers takes about ten minutes and removes the guesswork from any rate conversation with a lender.
-
Gather your inputs. You need: gross monthly income, total monthly debt payments (car loans, student loans, credit cards), available down payment, target loan term (30 or 15 years), and the current or target interest rate.
-
Estimate your monthly P&I. Use the formula from Section 2 or plug your numbers into a mortgage payment calculator. Your loan amount equals the purchase price minus your down payment.
-
Calculate your housing ratio. Divide the monthly P&I by your gross monthly income. Add estimated taxes and insurance (a rough estimate is 1.2%-1.5% of home value annually, divided by 12) to get a fuller picture. Lenders want this below 28%.
-
Calculate your total DTI. Add all monthly debt payments to the housing payment, then divide by gross monthly income. Use the DTI calculator to check this quickly. Stay below 43% for conventional loans.
-
Back into a maximum purchase price. If your DTI is too high at your target price, reduce the purchase price until the payment fits. The difference between what you want and what qualifies is your affordability gap.
-
Run three rate scenarios. Use the current rate, 0.25% higher, and 0.25% lower. This tells you how sensitive your qualification is to rate moves between now and closing.
Worked example: Gross monthly income of $8,000, $600 in monthly debts, $60,000 down payment, 30-year term, 6.5% rate. Target home price: $400,000. Loan amount: $340,000. Monthly P&I: approximately $2,149. Housing ratio: 26.9% (within the 28% limit). Total DTI: ($2,149 + $600) / $8,000 = 34.4% (well within 43%). This buyer qualifies at 6.5%. At 7.5%, the P&I rises to approximately $2,378, pushing total DTI to 37.2%, still qualifying, but with less cushion.
Pro Tip: Cross-check your results with a second calculator. For an independent comparison, the mortgage APR calculator at Platinum Capital Advisors shows the true annual cost including fees, which is often higher than the stated rate.
Practical ways to protect your affordability when rates rise
Increase your down payment
A larger down payment reduces the loan principal directly, which lowers both the monthly payment and the DTI. On a $400,000 home, moving from 10% down ($360,000 loan) to 20% down ($320,000 loan) cuts the monthly P&I by roughly $250 at 6.5%. It also eliminates private mortgage insurance (PMI), which typically adds 0.5%-1.5% of the loan amount annually.
Improve your credit score before applying
A 100-point credit score improvement can reduce your monthly payment by roughly $150-$200 by qualifying you for a lower rate. If your score is below 740, spending three to six months paying down revolving balances and disputing errors on your credit report can shift your rate tier meaningfully.
Shop multiple lenders and compare APR, not just rate
The stated interest rate and the annual percentage rate (APR) are different numbers. APR includes origination fees, points, and other costs, giving you a more accurate picture of total loan cost. Getting quotes from at least three lenders on the same day, so market conditions are equal, is the most reliable way to find the best offer.
Consider mortgage buydowns carefully
A buydown lets you pay upfront points to reduce the interest rate. One point typically costs 1% of the loan amount and reduces the rate by about 0.25%. Whether this makes sense depends entirely on how long you stay in the home. If you sell or refinance within five years, you likely will not recoup the upfront cost.
Adjustable-rate mortgages: useful in specific situations
An ARM offers a lower initial rate for a fixed period (commonly 5 or 7 years), then adjusts annually. If you are confident you will sell or refinance before the adjustment period, an ARM can reduce your initial payment. If you might stay longer, the rate risk is real and worth stress-testing against your budget.
Self-employed and irregular income buyers
If your tax returns understate your actual income, a common situation for business owners, 1099 contractors, and gig workers, standard qualification math may not reflect your real borrowing capacity. Bank statement loans evaluate 12-24 months of actual deposits rather than tax-return income, which can significantly change the qualifying picture. Texasbankstatementloans offers this path specifically for Texas buyers in this situation.
Why small rate moves have surprisingly large distributional effects
The NAHB’s Priced Out 2026 study puts a precise number on what a 25-basis-point rate reduction accomplishes: approximately 1.42 million additional U.S. households can afford a median-priced home. That estimate assumes a standard 30-year fixed loan, a fixed down payment, and median home prices, it is a national average, not a local guarantee. But the magnitude is striking: a quarter of a percentage point unlocks over a million households.
Why does a small move have such a large effect? Because U.S. household incomes are clustered near affordability thresholds. A large share of prospective buyers are not far below qualifying, they are right at the edge. A 25-basis-point shift moves the qualifying line just enough to include or exclude that cluster.
The St. Louis Fed’s analysis adds the mechanism: rising rates do not just reduce voluntary demand. They cause formal denials. Borrowers with stable finances, unchanged incomes, and good credit histories get rejected because the higher payment pushes their DTI above the lender’s hard threshold. This is a supply-of-credit constraint, not a borrower-quality problem.
Key caveats to keep in mind:
- NAHB’s 1.42 million figure uses national median home prices; high-cost markets see larger disqualification effects because local incomes are already compressed near underwriting limits.
- The DTI threshold effect is binary: a borrower one dollar above the cutoff is denied the same as one far above it.
- Timing matters, rate changes affect qualification immediately, but market prices and inventory adjust over months.
- Local job markets, new construction supply, and lender overlays can amplify or dampen these national patterns significantly.
Key Takeaways
Rising interest rates reduce monthly buying power and push DTI ratios above qualifying thresholds, making the difference between approval and denial for millions of borrowers whose incomes sit near affordability cutoffs.
| Point | Details |
|---|---|
| 25-bp moves matter at scale | A 0.25% rate reduction allows roughly 1.42 million additional households to afford a median-priced home, per NAHB. |
| Payment swings are large | The P&I on a $400,000 loan rose $1,265 from rate trough to peak in one CFPB analysis, a 78% increase. |
| DTI is the qualification gate | Higher rates raise projected payments, pushing DTI above lender cutoffs and causing denials for otherwise stable borrowers. |
| Prices lag demand | Rates change buyer demand quickly; home prices typically adjust months later as seller behavior and inventory shift. |
| Texasbankstatementloans option | Self-employed Texas buyers who qualify on bank deposits rather than tax returns can use Texasbankstatementloans to get a no-obligation qualification check in 60 seconds. |
The part most buyers underestimate about rate timing
Most buyers focus on the monthly payment number and stop there. That is the wrong place to stop.
The payment tells you whether you can qualify today. What it does not tell you is how your DTI will hold up if rates move between pre-approval and closing, or what happens to your liquidity if you stretch to the edge of your qualifying limit and then face a job disruption or a repair bill.
The conventional wisdom is to lock in a rate as soon as you find a home. That is reasonable advice, but it skips a more important question: have you stress-tested your budget at a rate 0.5% higher than your lock? Lenders approve you at the locked rate. Life does not always cooperate with the timeline, and rate locks expire.
The other mistake is chasing the absolute lowest rate without accounting for total cost. A buydown that costs $8,000 upfront to save $80 per month takes over eight years to break even. If you sell in five, you paid $8,000 for nothing. Running the break-even math before paying points is not optional, it is the calculation that determines whether the strategy actually saves money.
For self-employed buyers, the rate conversation is often secondary to the income documentation problem. If your qualifying income on paper is half your actual deposits, no rate improvement will close that gap. Solving the documentation problem first, through a bank statement loan or P&L-based qualification, is what makes the rate conversation meaningful.
Self-employed in Texas? Bank statement loans change the affordability math
The affordability calculations in this article assume a lender can verify your income cleanly from W-2s or tax returns. For self-employed buyers, 1099 contractors, and business owners, that assumption often fails, not because the income is not there, but because tax deductions reduce the reported figure well below actual deposits.
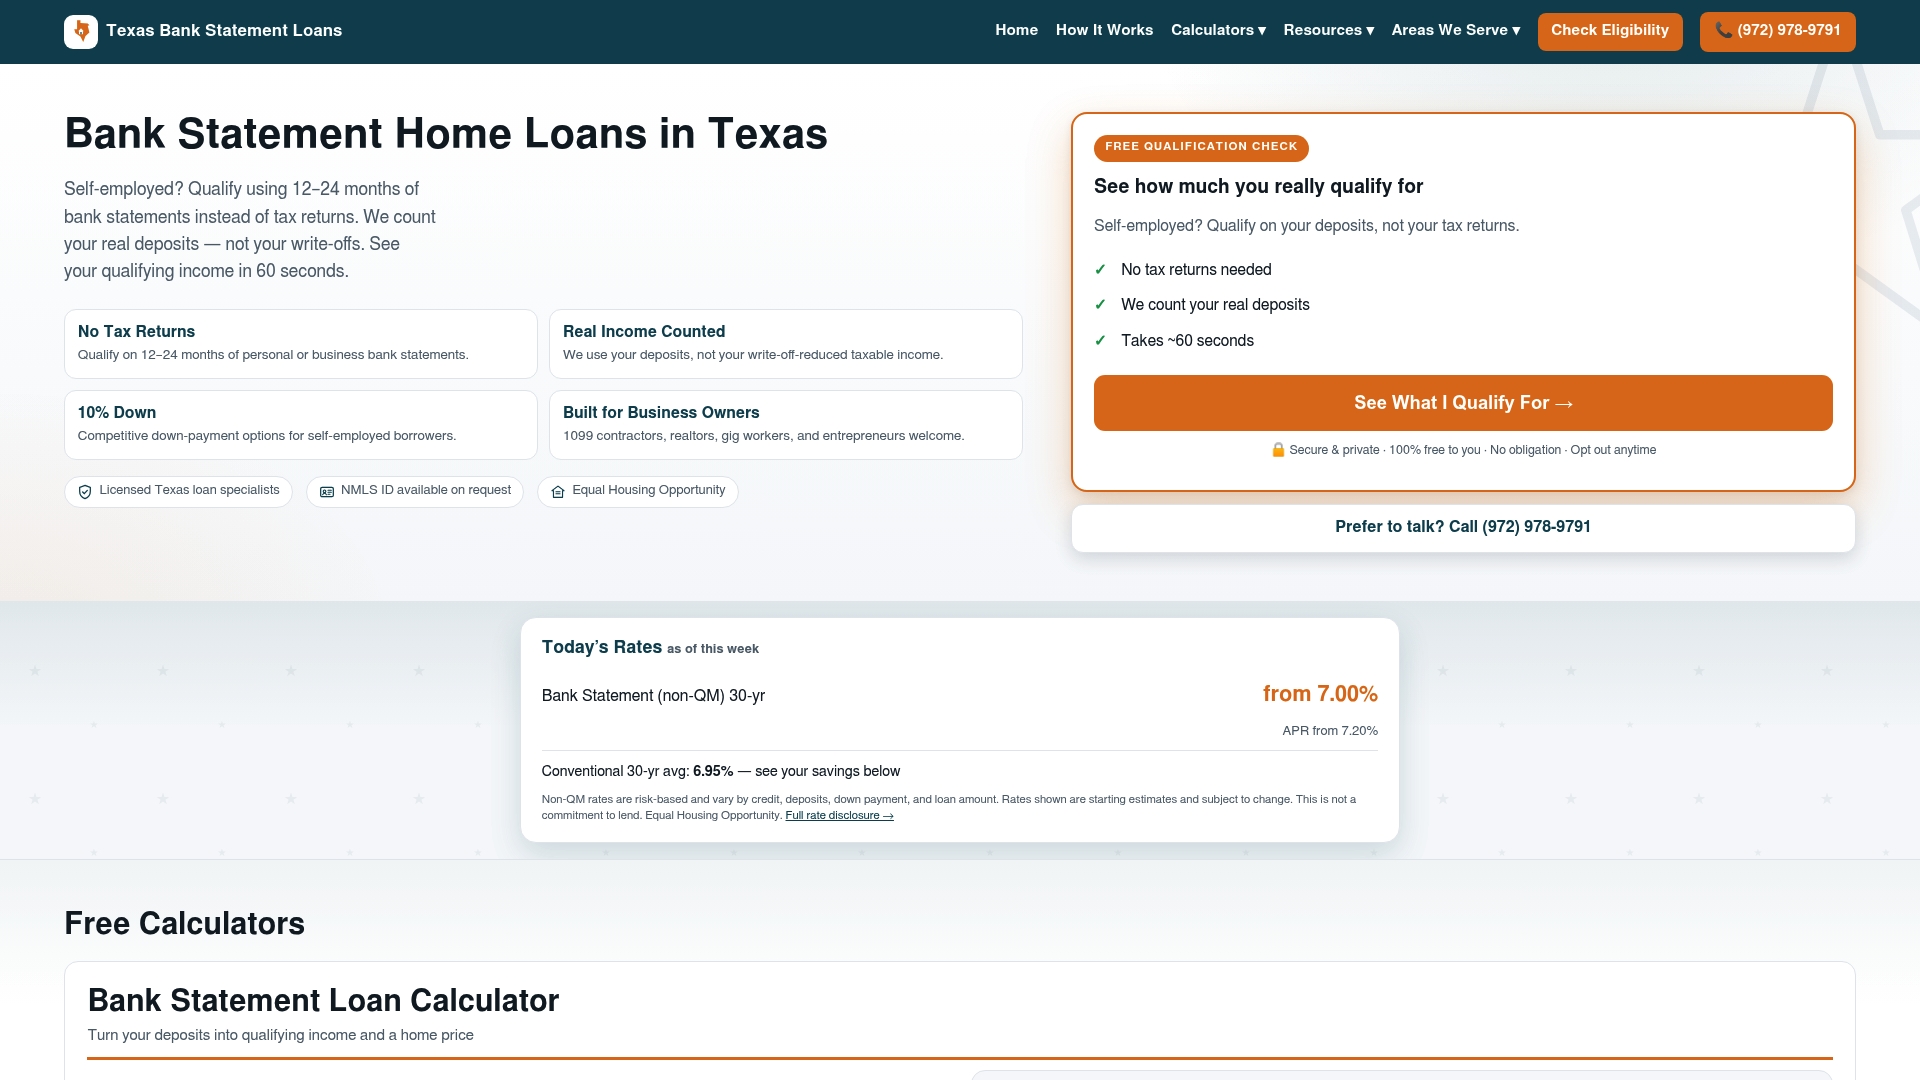
Texasbankstatementloans evaluates 12-24 months of personal or business bank deposits instead of tax returns, which means your qualifying income reflects what you actually earn. Down payments start at 10%, and a no-obligation qualification check takes about 60 seconds. The service covers major Texas markets, including Houston, Plano, Frisco, and Midland.
If you have been told you do not qualify based on tax-return income, the bank statement path is worth checking before you walk away from a purchase. See current bank statement loan rates or run your numbers with the self-employed affordability calculator to get a realistic picture of what you can borrow.
This article provides general information about mortgage affordability and interest rates. It is not financial or legal advice. Confirm current rates, underwriting requirements, and loan program eligibility with a licensed mortgage professional before making any borrowing decision.
Useful sources and further reading
The findings in this article draw from the following primary sources. Each covers a distinct piece of the affordability picture.
- CFPB: Data Spotlight, The Impact of Changing Mortgage Interest Rates, Payment delta analysis showing how the P&I on a $400,000 loan changed from rate trough to peak; also covers refinancing access disparities by borrower profile.
- NAHB: Priced Out 2026, The source for the 1.42 million households per 25-bp rate reduction estimate, with methodology and assumptions explained.
- St. Louis Fed: The Impact of Rising Interest Rates on Mortgage Borrowing, Explains the DTI distribution shift mechanism and why rising rates cause formal denials rather than just voluntary demand drops.
- Texasbankstatementloans: Free Mortgage Calculators and Tools, Calculator suite for estimating monthly payments, DTI, and bank-statement qualifying income under different rate scenarios.
- Platinum Capital Advisors: Mortgage APR Calculator, Converts a stated rate into APR including fees, useful for comparing true loan costs across lenders.
Use these sources alongside conversations with a licensed lender who knows your local market. National figures are a useful baseline; your actual qualifying rate, payment, and purchase price depend on your specific income, debts, credit profile, and the property itself.
Recommended
- Bank Statement Loan Rates Today | Texas Bank Statement Loans
- Free Mortgage Calculators & Tools | Texas Bank Statement Loans
- Self-Employed Affordability Calculator | Texas Bank Statement Loans
See what you qualify for in 60 seconds, free and no credit check. Use the eligibility check at the top of this page.